


Welcome to the
Online Exhibition
for MADE@QC

This is the online exhibition for the Mathematical Art Digital Exhibition at Queens College. The artwork shown on the digital screens in the Department of Mathematics at Queens College has QR codes that direct here to provide additional information about the artwork and the artists.
You are invited to scroll at your leisure and experience the breadth of mathematical ideas that feature in these pieces.
This exhibition was curated by Christopher Hanusa.


Reality and Imagination (2023)
Elke Stangl
Digital image created with custom javascript code, using the framework three.js
Real and imaginary part of the complex function 1/z, envisaged as cityscape or space station. Celebrating the beauty of a seemingly simple function!
The contour lines of these two functions are perfect circles – rings which are aligned along the circumference. Stacking these rings gives rise to tower-like structures. Gold is the color of reality; Blue is the color of imagination. The asymmetric towers lean on each other: they meet in the vertical axis, and they can be rotated into each other.
In a series of images, these virtual structures are shown from different viewing angles.
The Artwork in More Detail
This artwork is part of the series Reality and Imagination: Digital images created with custom code, based on the complex function 1/z. The idea is to find beauty and inspiration in the bare essence of mathematics! Seemingly simple mathematical concepts sparkle and glitter, if viewed from the right vantage point.
Real and imaginary parts of the complex function 1/z are envisaged as a cityscape or a space station: Two towers are floating through empty space. Infinitely elongated bells.
In a series of images, these virtual structures are shown from different viewing angles. The contour lines of these two functions are perfect circles – rings which are aligned along the circumference. Stacking these rings gives rise to tower-like structures. Gold is the color of reality; Blue is the color of imagination.
Elke Stangl’s (elkement) artworks related to functions over the complex plane had originally been inspired by Roger Penrose’s book The Road to Reality. Penrose introduced complex functions as fundamental building blocks of mathematics used in theoretical physics. His engaging examples of the “magic of complex numbers” let elkement explore these functions: First with mathematics software SageMath, then using javascript and the framework three.js.
The asymmetric towers lean on each other, and they intersect each other. They meet in the vertical line erected at the zero point. x and -y are π/2 apart, speaking of them in terms of the complex plane. These towers can be rotated into each other. They chase each other, one lagging by π/2, like current and voltage in a resonant circuit, like force and amplitude of an oscillation.
If z is expressed as x + iy, real and imaginary parts of 1/z are obtained by multiplying nominator and denominator by x – iy. Moving away from the zero point, x2 + y2 in the denominator finally wins, and both parts become zero. Denominators are x for the real part and -y for the imaginary part. At the zero point, the denominator goes to zero faster than the nominators, thus both parts have poles. As x and -y change sign when the zero point is crossed, each function is made up of two infinite towers, one extending to infinity, the other to minus infinity.
The image is a scientific visualization of sorts: Contour lines have been promoted to metallic tubes to make the structures both ethereal and solid, and the viewpoint has been chosen to make it more enigmatic than educational. It is an invitation to ponder about the mathematics of complex functions, but it should also speak to viewers who are not familiar with the underlying concepts
A page dedicated to the series Reality and Imagination: https://elkement.art/reality-and-imagination/

About the Artist
Elke Stangl (elkement) (she/her) is an Austrian physics PhD working as an engineer. Her mathematical art is borne out of her life-long passion for the theoretical underpinnings of her craft. She is creating virtual three-dimensional structures from mathematical functions – digitally with code or with ruler and compass, using traditional techniques of descriptive geometry.
Her initial inspiration was Sir Roger Penrose’s book The Road to Reality, the hand-crafted drawings created by the author, and Penrose’s focus on the magic of complex functions.
elkement is often exploring the artistic potential of functions she has been using in a professional context – like the mathematics underlying the diffraction of light or heat transfer.
Artist’s website and blog: elkement.art/
Artist profile on Cara: cara.app/elkement
Find elkement on Bluesky: bsky.app/profile/elkement.art
Related Links
Learn more about complex analysis on Wikipedia.
Inside Thurston geometries (2023)
Rémi Coulon, Sabetta Matsumoto, Henry Segerman, and Steve Trettel
Digital video created by software written in Javascript/GLSL
We are all very familiar with Euclidean three-dimensional space. But there are other possible geometries for 3D space. Thurston defined eight particularly nice geometries, as part of his Geometrization conjecture, which was proved in 2003 by Perelman. In our animations, we show what you would see if you were to live inside of these geometries, assuming that light rays travel along geodesics – the paths of shortest length.
The Artwork in More Detail
3-dimensional.space is joint work by Rémi Coulon, Sabetta Matsumoto, Henry Segerman, and Steve Trettel to render accurate images of the eight Thurston geometries and their quotients. We make this software accessible to explore and encourage you to visit our website that hosts various demonstrations we have created along the way, as well as tutorials and documentation for the codes.

About the Artists
Rémi Coulon is a Senior Researcher in mathematics at the CNRS in France. His research interests include geometry, topology, dynamics, as well as mathematical illustrations.
Sabetta Matsumoto is an Associate Professor in the School of Physics at the Georgia Institute of Technology. She is passionate about using textiles, 3D printing, and virtual reality to teach geometry and topology to the public.
Henry Segerman is an Associate Professor in the Department of Mathematics at Oklahoma State University. His interests include geometry and topology, 3D printing, virtual reality, and spherical video.
Steve Trettel is an Assistant Professor in the Department of Mathematics and Statistics at the University of San Francisco. His interests include geometry, topology, and computer graphics for mathematical illustration.
Related Links
Learn more about Non-Euclidean geometry on Wikipedia.
Explore these geometries on your own: 3-dimensional.space.


Spreadsheet Chaos (2024)
Melissa K. Houck
Digital images created using Microsoft Excel
A spreadsheet program like Excel can be used to visualize the concept of chaos theory by iterating complex functions and testing the convergence of the results. A grid of complex numbers (which are 2-dimensional) is the starting point. A formula is applied to this grid, and then the resulting grid can be iterated multiple times using the same or a different formula each time. Conditional formatting of the absolute value of the final grid is used to visualize the result. There are infinite possible combinations of formulas, starting grids and formatting. The selections I included represent a diversity of formulas, patterns and colors.
The Artwork in More Detail
The starting point is a row of real numbers, xn, that decrease incrementally and a column of imaginary numbers, yn, that increase incrementally. A starting grid is created by applying a complex formula to each row/column combination z (= xn+iyn).
For Forces, Web and Pearls, the starting grid formula was a polynomial [1-za]b. For PMax, the starting grid formula was Ln[z].
The formulas applied to create each iteration were chosen to result in a variety of interesting patterns, and usually involved varying the formulas used for each iteration.
Forces started with 4-3i times a complex power 11+.1i that alternated to -12-.05i each iteration except for Iteration 3, which was the complex tangent of Iteration 2.
Web alternated the complex tangent with the complex natural logarithm, with the exception of Iteration 5, which was Iteration 4 raised to the power of negative 12.
Pearls alternated the complex exponential, (ez), with the complex natural logarithm for the first five iterations, then used -i times a complex power which alternated each iteration between -13-.2i and 13+.2i.
PMax used the complex power -21-.1i for all iterations.
For visualizing the final grid of absolute values, I used Excel’s conditional formatting setting that assigns 3 different colors based on the percentile of numeric results. I used percentile rather than percent or number because it colors each pixel according to their value relative to the other values in the grid. The choice of percentiles and colors involved trial and error as to what looked most interesting.

About the Artist
My name’s Melissa Houck and I’ve worked as an actuary in the Philadelphia area for many years. I enjoy reading “popular math” books that bring mathematical concepts to life in layman’s terms. Because I use Excel so much in my work, I find myself using the spreadsheet program to visualize and help me understand the topics I read about; It helps me break in to the “black box” of advanced mathematical concepts.
Related Links
Learn more about Complex numbers and Complex Analysis on Wikipedia.

Abiogenesis (2023)
Russell Prather and Daniel Rowe
Tinted acrylic medium on transparent film. This is a double-sided painting, with the tinted acrylic medium applied to both recto and verso.
We interpret a triangular partition to be a partition of a triangular number (whose dots are arranged into an equilateral triangle) up to the natural symmetries of the triangle. In general, there are more triangular partitions than classic partitions and are very interesting to enumerate. Triangular partitions serve as an organizing principle for this piece, imparting to these abstract paintings an underlying order that is not overly fixed or rigid, but flexible and variable.
The Artwork in More Detail
From the mathematician’s perspective:
In mathematics, the notions of “integer partition” and “triangular number” are well known concepts. We were inspired by a specific interpretation of the notion of “triangular partition” – one that is totally distinct from the more standard definition of a triangular partition that has gained recent popularity. The more standard definition of a triangular partition in mathematics is a partition whose Ferrer diagram is “cut off” by a straight line (see link below). This is not the notion of triangular partition that inspired this work. Instead, we interpret a triangular partition as a partition of a triangular number (whose dots are arranged into an equilateral triangle) up to the natural symmetries (rotations and reflections) of the triangle. In general, there are more of these objects than plain old partitions. It is very interesting to try to calculate the number of these “triangular partitions” for a given triangular number.
From the artist’s perspective:
My interest in mathematical art stems from a series of inspiring conversations I have had with an art-curious friend and colleague, mathematician Dan Rowe. Dan has been teaching me about mathematical concepts that are potentially applicable to the visual arts, including “triangular partitions.” For Abiogenesis I selected, from an array of differently partitioned 15-dot equilateral triangles, configurations that seem visually interesting. These I combine and overlap in double-sided paintings using pigmented acrylic medium on a transparent film called DuraLar. Though I sometimes end up warping the partitions, it is still possible to identify the discrete triangles, especially when there’s a grid of dots in the background, as in Abiogenesis. The partitions serve as an organizing principle, imparting to these abstract paintings an underlying order that is not overly fixed or rigid, but flexible and variable.


About the Artists
Russell Prather was born in Canada to American parents, I was raised in Calgary by the Rocky Mountains. I studied philosophy and animation at the University of British Columbia in Vancouver, and prior to this and in the 10 or so years that followed, was engaged in nonremunerative art-related endeavors supported by jobs including graphic designer, newspaper reporter, tree-planter, groundskeeper, and roughneck on an oil rig. I eventually landed in graduate school at the University of Washington in Seattle, my studies culminating in a Ph.D. dissertation on the illuminated books of artist/poet William Blake—a deep and enduring influence on my creative practice. After a year-long Fulbright Fellowship in Marrakech Morocco, I moved to Marquette, Michigan to begin teaching at Northern Michigan University.
Daniel Rowe is an associate professor of mathematics at Northern Michigan University. Daniel holds a bachelor’s of mathematics from the University of Waterloo, and a MSc and PhD in mathematics from the University of Toronto. Daniel grew up on a fishing camp in Northwestern Ontario, Canada, and has been a long-time enthusiast of both art and mathematics.
This collaboration grew out of their shared interest in art, geometry, philosophy, and mathematics. Many conversations eventually inspired these depictions, which are based on the ideas of partitions of triangular numbers modulo the natural symmetry group action.
Related Links
Learn more about Integer partitions and triangular numbers on Wikipedia.
Here is an interesting alternate definition of a triangular partition: https://arxiv.org/pdf/2203.15942

Dreamland Fields (2011)
Teja Krašek
Digital image created using various computer tools
Fractals are self-similar geometric shapes that display details on all scales. Their fascinating beauty reveals a wealth of detail upon successive magnifications. The term “fractal” was coined by the famous mathematician Benoit Mandelbrot in 1975. With the help of powerful modern computer technology, fractals were extensively explored by mathematicians, computer scientists, and artists ever since. My “Dreamland Fields” was created while exploring the depths of the 5th order Newton/Mandelbrot set fractal. The famous simple equation for the Mandelbrot fractal (Zn+1 = Zn2 + c) generates an infinite number of complex and beautiful images.
An expanded description of the artwork
Fractals are self-similar geometric shapes that display amazing details on all scales. Their fascinating beauty reveals a wealth of detail upon successive magnifications. The term “fractal” was coined by the famous mathematician Benoit Mandelbrot in 1975. With the help of powerful modern computer technology, fractals were extensively explored by mathematicians, computer scientists, and artists ever since. My “Dreamland Fields” image was created while exploring the depths of the 5th order Newton/Mandelbrot set fractal. It consisted by navigating through numerous regions of that particular fractal landscape, as well as using various magnification factors until this beautiful dreamlike composition was brought into existence.
The famous simple equation for the Mandelbrot fractal (Zn+1 = Zn2 + c) generates an infinite number of complex and mesmerizing images. There are many fractal-generating tools available in today’s techno-world for all curious art and mathematics loving minds to enjoy, and create mathematical beauties the magical universe of fractals offers and makes our hearts sing.

About the Artist
Teja Krašek is a mathematical artist who lives in Ljubljana Slovenija. Her theoretical, and practical, work is especially focused on symmetry as a linking concept between art and science, and on filling a plane with geometrical shapes, especially those constituting Penrose tilings (rhombs, kites, and darts). The artist’s interest is focused on the shapes’ inner relations, on the relations between the shapes and between the shapes and a regular pentagon. These artworks illustrate certain properties: golden mean relations, self-similarity, fivefold symmetry, the Fibonacci sequence, inward infinity, perceptual ambiguity, and more. Krašek’s work concentrates on melding art, science, mathematics and technology. She employs contemporary computer technology as well as classical painting techniques.
Artist’s website: tejakrasekart.blogspot.com
Artist’s YouTube: youtube.com/@tejaK/videos
Artist’s Leonardo: leonardo.info/led/837
Artist’s X / Twitter: twitter.com/tejaKrasek
Related Links
Learn more about the Mandelbrot set on Wikipedia.

Symmetry Series #21 (2023)
Andrew Werth
Acrylic on canvas
Turing Patterns are spatial patterns formed by a process of reaction-diffusion first suggested by British mathematician Alan Turing. Turing suggested that this process was responsible for morphogenesis in nature (e.g., patterns on animals like zebras or giraffes). These patterns can be created by repeatedly blurring and sharpening an initial seed image, in this case, an image of symmetric random noise. Once I have a design I like, the artwork is created by hand-painting thousands of individual marks of colors whose gradients interact to produce a sense of depth and luminosity.
The Artwork in More Detail
Near the end of his life, the British mathematician Alan Turing proposed a groundbreaking mechanism for the formation of spatial patterns in nature, known as morphogenesis. This occurs when two or more chemicals react in just the right way while diffusing through a substrate, resulting in formations now referred to as Turing patterns.
For nearly fifteen years, I have explored Turing patterns in my abstract artwork. The reaction-diffusion process Turing proposed can be simulated in various ways, and my approach often involves repeatedly blurring and sharpening an initial seed image until a stable pattern emerges. Sometimes I work with image editing software like Adobe Photoshop, but for the Symmetry Series, I developed custom Python software to handle this process.
Each piece in this series begins with a random grayscale image, which I mathematically “fold” to create horizontal and vertical symmetry. The software then repeatedly applies blurring and sharpening, simulating Turing’s reaction-diffusion process until a stable pattern is achieved.
Once I find a pattern that resonates aesthetically, I use it as the foundation for a painting. The Turing pattern becomes the underpainting, onto which I layer thousands of hand-painted marks in acrylic, working with carefully mixed color gradients. My goal is to create a dynamic visual experience where the viewer is continually drawn in, discovering new elements from different angles, distances, and lighting conditions.
Andrew Werth wrote an article and gave a presentation about Turing patterns in Photoshop for the Bridges conference in 2015.

About the Artist
Andrew Werth has been exhibiting his philosophically-inspired “organized organic abstraction” paintings at galleries throughout the New Jersey / New York / Pennsylvania area since 2005. Highlights include solo exhibitions at The Monmouth Museum (Lincroft) and The Center for Contemporary Art (Bedminster), showing multiple times at Art Fair 14C in Jersey City, and various group shows in New York City, Philadelphia, Lambertville, West Windsor, and Trenton. Although his formal degrees are from Carnegie Mellon University in Computer Engineering and Information Networking, he self-directed an arts education that drew from many of the arts institutions in New York City, including the School of Visual Arts, The New School, and the Art Students League.
Artist website: andrewwerth.com
Artist instragram: instagram.com/artistandrewwerth
Related Links
Learn more about Turing patterns on Wikipedia.

Coen’s Collatz Conjecture on White (2021)
Joe Coen
Digital image created using Processing 3
Given an initial positive integer n, the next term in the Collatz sequence is defined by the following rule. If n is even, then d = n/2. If n is odd, then d = 3n + 1. Repeat, using the resulting answer d. The Collatz Conjecture, which remains unproven, is that for any number n you pick, the sequence will always converge to 1. However, some numbers take longer to converge to 1 than others. This image tests all the numbers to 10,000 and visualizes the amount of time it takes for each number to converge to 1.
The Artwork in More Detail
For this work, the location of each circle in the plane is determined by plotting the path of all the results of the sequence for a given input, translating the graph accordingly and rotating it a little clockwise if even and counterclockwise if odd. This rotation is just to make the graph look “less” cluttered and doesn’t really have much to do with the Collatz conjecture other than using the intermediate d value’s oddness or evenness for the angle of rotation, which is constant.
Example: the initial value n is 1. 1 is odd, so multiply by 3 and add 1. Result is 4. The program translates up 4 from the lower left corner (the origin) and rotates a small angle clockwise. Since 4 is even, divide 4 by 2. Result is 2. The program translates up 2, and rotates a small angle clockwise. This process continues until the sequence produces a 1. At that point, where ever it may be, the program plots a circle. The number of steps the program takes to converge to 1 is used to determine the circle’s radius.
Then, the program moves to the next whole number 2 and repeats. Each new “path” starts from the lower left hand corner. This program tests all the integers up to 10,000.
So, in summary, the radius of each circle is the equal to the number of steps it takes for the sequence to converge to a 1, and the location in the plane is a result of all the rotations and the “length” of the path until the function converges to 1.
The color palette I used pretty much just cycles though ten possible colors.

About the Artist
Joe Coen is an artist in Houston, Texas.
To a lot of kids, math is nothing more than an esoteric exercise in repetitiveness. Solve for x, graph this, prove that. Over the course of my teaching career, I had to seize upon different approaches to make math more interesting and more approachable. Applying mathematic principles to making art was one of them. We tessellated. We created chaos.
That was a career ago. But the use of math, especially the idea of using chance, probabilities and randomness to generate art has stuck with me. We make choices all of the time in life and in art. An artist is faced with myriad of choices; the medium, the subject, the method, the color, and the constraints of those choices, just to name a few. I try to express that in my work. I don’t know how a work really is going to turn out, because every time I run a program, the result is different. Depending on the constraints I set, it dances between order and chaos. Just like life.
Joe Coen on Instagram at instagram.com/jwcoenmathart
Joe Coen’s psychedelic sci-fi comic Gray vs. Grey in Color: jwcoenartist.com
Related Links
Learn more about the Collatz Conjecture on Wikipedia.
The Simple Math Problem We Still Can’t Solve in Quanta Magazine

Sphere Eversion (2021)
Jean Constant
Mixed media ink on canvas
To evert a sphere is to turn it inside-out by means of a continuous deformation. It allows the surface to pass through itself. Blind mathematician Bernard Morin demonstrated that an eversion based on a Morin surface halfway model has the minimum possible number of topological events. The University of Illinois hosts John Sullivan’s extended paper on this topic.
The Artwork in More Detail
Mathematics is often a combination of hard work and happenstance. So is art.
I use mathematics, principally geometry, as a source of inspiration for my work. The actual mathematical description of events is a process of discovery of Nature and the world we live in. Like landscape painters, while it may seem odd at first, I consider myself a painter of Nature and the hidden elements that compose it because all my work is based on solid, provable phenomena discovered first by mathematicians.
* Minimal surfaces for example: in the late 1800s, physicist J. Plateau1 found that soap bubbles characterized minimal surfaces best. This keen observation of a problem mathematicians have been studying since antiquity is not inconsequential. These elegant and complex shapes found in Nature from butterflies, beetles, or black holes are studied today in statistics, material sciences, molecular engineering, and architecture.
In a 52-illustration project from which Sphere Eversion is extracted, I entrusted mathematicians to provide me with an accurate description of the many surfaces they discovered to explore the visual and poetic aspects of these intriguing forms.
A sphere eversion is a way to evert a sphere is to turn it inside-out by means of a continuous deformation. It allows the surface to pass through itself. Blind mathematician Bernard Morin demonstrated that an eversion based on a Morin surface halfway model has the minimum possible number of topological events. The University of Illinois hosts John Sullivan’s extended paper on this topic: John Sullivan (1999). A History of Sphere Eversions. https://www.mi.sanu.ac.rs/vismath/sullivan/opt2.htm
* Excerpt from the book Minimal Surfaces, The Math-Art series, volume 13.

About the Artist
I am a researcher in Visual Communication involved in collaborative projects between mathematics and art. I am also the author of the Math-Art series available online or in print with all the major distributors.
Art historians tell us art is either realistic or abstract. Because it’s a journey of discovering Nature’s existing structures, mathematics gives us a way to bridge the two forms of expression. Whenever I create a work inspired by some mathematical concepts, I always end up with the intense feeling of representing just another aspect of our environment, portrait, or landscape that numerous artists depict so well. Nature, indeed, is made of many parts, seen and unseen.
Artist’s Gallery: saatchiart.com/jconstant
Artist’s Books: https://books.apple.com/us/author/jean-constant/id654881538
Virtual Art Gallery to accompany Geometry of Prime Numbers.
Related Links
Learn more about sphere eversions on Wikipedia.
Hétérozygotes (2020)
Jérôme Guilleaume
Digital video created using the open source software IanniX.
This piece was created by assembling four transformations of the same three-dimensional parametric curve, which are the same form observed at different moments in time. The four curves have been aligned into two pairs of curves in opposition, appearing to pull apart as in the biological process of mitosis. The animation presented here is an exploration of the static scene from the viewpoint of a camera maneuvering around the curves through space.
The Artwork in More Detail
This piece was created by assembling four transformations of the same three-dimensional parametric curve, which are the same form observed at different moments in time. The equations that generate the curves involve simple trigonometric functions that have gained a complex form by introducing parameters that are carefully adjusted by hand.
The four curves have been aligned into two pairs of curves in opposition, appearing to pull apart as in the biological process of mitosis.
This symmetric scene exists statically in space with curves that do not overlap but come together to form a single piece that projects a feeling of movement. The animation presented here is an exploration of the static scene from the viewpoint of a camera maneuvering around the curves through space.

About the Artist
Jérôme Guilleaume is a multi-disciplinary artist based in Montreal. He is fascinated by movement, language, math and their intersection. His work is a visual exploration of mathematical equations, as explorable matter, through printed, virtual or projected media. This project presents years of exploration, through trials and error, trying to find beauty and fragility through a chaotic creative process. This project is destined to be presented either in movement, as installation and performance or fixed in into sensitive, fine natural forms, in limited printed editions or drawn as unique pieces, with a pen plotter. A tentative grasp to the ephemeral. His holistic artistic approach links sound and visual art, through contemplatives and organic transformations, as Guilleaume’s view of mathematics is rooted in the belief that they convey more sense in movement and have foundation in real life.
Artist’s website: mathart.ca
Learn about his creative process in this YouTube video (in French)
Related Links
Learn more about parametric equations on Wikipedia.
Learn more about IanniX, a graphical open source sequencer, based on the works of Iannis Xenakis.


Eigenfish (2024)
Simone Conradi
Digital image created with Python using Matplotlib and Numpy packages
Each artwork represents eigenvalues in ℂ for the shown parametric matrix, sampled with 2,000,000 values of the parameters t₁ and t₂ within the range [-20, 20] x [-20, 20]. Each point on the graph is an eigenvalue in the complex plane. In the dark areas, the eigenvalues are denser, while in the light areas they are less dense. Dithering emerges from the natural distribution of eigenvalues.
The Artwork in More Detail
A combination of Experimental Mathematics and Visual Art
Experimental mathematics is a unique approach that combines computation, intuition, and formal proof. It emphasizes the use of computational tools, visualization, and numerical experiments to explore mathematical phenomena, uncover patterns, and develop conjectures. As Kurt Gödel once noted, if mathematics describes an objective reality, inductive methods, similar to those used in physics, can also be applied in mathematics. Jacques Hadamard echoed this sentiment, asserting that mathematical rigor serves to validate the insights gained through intuition.
In this spirit, experimental mathematics becomes a powerful tool for fostering intuition and discovery. It plays a crucial role in mathematics education by allowing direct engagement with mathematical objects, helping to develop deeper understanding.
My exploration in this field often involves writing Python code in Jupyter notebooks, which provide a robust platform for numerical computation, data manipulation, and advanced visualization.
The central question of the “Eigenfish” series is: how are the eigenvalues distributed in the complex plane when two matrix elements are treated as real parameters, t1 and t2, and allowed to vary?
An elegant theorem known as the Gershgorin circle theorem describes a region in the complex plane that contains all the eigenvalues of a square matrix. These regions, composed of circles, are straightforward to compute and visualize. However, my work extends this by computing and visualizing eigenvalues through Python, using NumPy and Matplotlib.
The resulting images depict eigenvalues in the complex plane for matrices with elements drawn from the set {0, -i, i, 1, 1/2}, with 2,000,000 random samples of t1 and t2 within the range [-20, 20]. The parameters are randomly selected, and while the insights gained from this visualization are uncertain, the result is undeniably a striking piece of mathematical art.
This blend of experimental mathematics and visual art showcases the beauty of mathematical exploration, where the process of discovery is as significant as the final result.
Concept and Process
At the core of this project is the Eigenfish class, a custom Python class designed to generate and manipulate matrices, with a particular focus on their eigenvalues. Here’s a breakdown of the process:
- Matrix Structure: The foundation of each eigenfish is a square matrix. Specific elements within this matrix are designated as variables, represented by parameters t1,t2,…,tn. These parameters can be adjusted, leading to a dynamic matrix that changes with each iteration.
- Parameter Sampling:
-
- Rectangular Distribution: Parameters t1,t2,…,tn are sampled from a uniform distribution within a defined range [−r, r], or from a normal distribution with a specified standard deviation. These distributions create varying eigenvalue patterns depending on the range or spread of the sampling.
- Torus Distribution: Alternatively, parameters can be sampled uniformly from a toroidal surface, producing eigenvalue patterns with a circular symmetry, reflecting the periodic nature of the torus.
-
- Eigenvalue Calculation: For each sampled set of parameters, the eigenvalues of the matrix are computed. These eigenvalues are the roots of the characteristic polynomial of the matrix and can be visualized in the complex plane.
- Visual Representation: The calculated eigenvalues are plotted, often in the complex plane. The collection of these points forms the visual art piece, with patterns emerging based on the distribution and behavior of the eigenvalues.
Eigenfish art invites viewers to appreciate the inherent beauty of mathematical structures, transforming the intricate relationships of matrices and their eigenvalues into visual art that is both intriguing and intellectually stimulating.
Simone Conradi has written an article about the artwork Eigenfish: https://doi.org/10.57037/b-imi.00104.1mas400

About the Artist
Simone Conradi graduated with honors in theoretical physics in 2004 with a thesis on non-commutative field theories. In 2008, he earned a doctoral degree in theoretical physics from the University of Genoa, where he conducted research on the properties of high-temperature quark-gluon plasma through numerical lattice simulations.
Subsequently, after 10 years of experience in the railway automation sector at Ansaldo STS/Hitachi Rail, where he held various roles including Developer, System Designer, and Work Package Leader, he transitioned to a career as a consultant, applying mathematical models and machine learning algorithms to finance. Currently, he is a computer science teacher at ITIS Delpozzo in Cuneo and is also qualified to teach mathematics and physics. He is actively involved in developing STEM teaching methodologies and in introducing artificial intelligence into school education.
He is author of the book Intelligenza Artificiale, published by Zanichelli.
Among his current scientific interests, we find machine learning, computational physics, and teaching methodologies for STEM subjects.
Artist’s website: github.com/profConradi
Related Links
Learn more about eigenvalues on Wikipedia.

Sierpiński Links (2024)
Catherine Greenhill
Digital image created using ArtRage
The Sierpiński triangle is a beautiful mathematical object created using recursion. Here we see an evolving Sierpiński triangle, with different levels of recursion present simultaneously, depicted using an interlaced pattern reminiscent of ancient Roman, Celtic or Islamic art. In knot theory, a knot consists of one continuous strand, while more than one intertwined strand is called a link. So this piece shows Sierpiński links.
The Artwork in More Detail
Interlace patterns are found in ancient Roman, Celtic and Islamic art. One way to design an interlace pattern is to first draw the underlying graph (or network), and then weave the ribbons of the design around this frame. By following a simple procedure, the interlace pattern corresponding to the graph reveals itself. Usually the frame is then removed so that it is not visible in the final design.
The frame for this interlace pattern is related to the Sierpiński triangle, which is a beautiful mathematical object created using recursion. Starting from an equilateral triangle, join the midpoints of each edge in pairs using straight lines. This partitions the original triangle into four smaller triangles, with the middle triangle upside-down. Remove this upside-down triangle, leaving three smaller triangles behind. This is the end of step 1 of the recursion. Now repeat this process on these three smaller triangles, removing three even smaller upside-down triangles: this completes step 2 of the recursion. Keep going as many times as you like to create an intricate, self-similar pattern of triangles.
To create the frame for this piece, I put a twist on the Sierpiński triangle construction by stopping at different levels of recursion in different parts of the design. This led to a kind of multiscale effect that I found interesting. When I added the interlace ribbons to this frame, many circles naturally arose at these different scales.
In knot theory, a knot consists of one continuous strand, while more than one intertwined strand is called a “link”. So I called this piece Sierpiński Links.

About the Artist
My name is Catherine Greenhill. I am a mathematics professor at UNSW Sydney with research interests in graph theory (networks). I have always enjoyed doodling, and I particularly like creating art with some kind of mathematics behind it. I like the logic and structure of interlace art (such as Celtic knots) and the connection with graph theory: for every planar graph you can create a piece of art by following some simple steps.
Artist’s website: web.maths.unsw.edu.au/~csg/
Catherine Greenhill’s article How to draw knots on grids and graphs, published in the online high school mathematics magazine Parabola in 2022.
Related Links
Learn more about the Sierpiński triangle and knot theory on Wikipedia.

Eroded Sandpile (2024)
Benjamin R. Trube
Digital image created using Python/Cython
This piece is an Abelian Sandpile, a cellular automaton played with virtual grains of sand. Sand is added to 4 initial drop-spots (totaling 3.2 million grains) on a grid containing 2 grains of sand in each cell. Sand is moved to its neighbors when a cell contains 4 grains of sand or more. This process repeats until all cells contain 3 grains of sand or less. In this image, the sand is then eroded for several iterations, with 1 grain of sand removed from each cell if less than 2 neighbors contain 3 grains. The cells are colored according to the remaining sand, producing a fractal-like pattern.
The Artwork in More Detail
This piece is an Abelian Sandpile, a cellular automaton that simulates the movement of virtual grains of sand. The Abelian Sandpile model was first described by physicists Per Bak, Chao Tang, and Kurt Wiesenfeld to illustrate how natural systems can self-organize into a critical state (like an avalanche) without needing the trigger of a catastrophic event.
In a typical sandpile, sand is added randomly throughout the grid, or in large quantities in a few cells. Each cell that contains four grains of sand or more is toppled, moving an equal quantity of sand grains to its four Von Neuman neighbors (the four cells directly adjacent to the current cell). Toppling is an abelian operation because the order in which cells are toppled does not affect the resulting sandpile. This process repeats until all cells contain three grains of sand or less at which point the sandpile has stabilized. Cells are then colored according to the number of grains they contain, producing a fractal-like pattern.
The sandpile in this artwork was generated on a regular grid, 3201 × 3201 cells in size, with a uniform seed of two grains of sand per cell. An additional 3.2 million grains of sand were distributed evenly between four drop-spots at an equal distance from the center of the grid. The sandpile was then toppled and stabilized using the process described above.
Before coloring the stabilized pile, I applied a process that “eroded” the sand further. Each cell was checked simultaneously to see if it had at least two Von Neuman neighbors that contained three grains of sand. If it did not, one grain was removed from that cell (and the entire sandpile). I repeated this process for three iterations. This had the effect of removing noise and sharpening the detail of the remaining features. I did this to further simulate natural processes, treating the sandpile not as a fixed object, but something affected by the passage of time and the elements.
Cells containing 0 grains of sand are colored black, 1 grain light blue, 2 grains purple, and 3 grains tan. Colors were selected to increase contrast and for aesthetic appeal.

About the Artist
I’m a software engineer and fractal artist working with self-developed programs. I enjoy fractals for their variety and their complexity that arises from simplicity. My process is both playful and iterative; I will often generate dozens of images before settling on a favorite. For the past few years, my focus has been on variations of the Abelian Sandpile Model, poking and prodding its simple rules to produce something unique and beautiful.
Artist’s website: bentrubewriter.com
Related Links
Learn more about the Abelian sandpile model on Wikipedia.

Of Time and Cosmos: Category (2022)
Sophia Wood
Digital image created using Procreate and Fresco on an iPad
As I explored the category theory prompt from Mathober 2022, I thought about how language could be sorted and connected through mathematical structures. Phrases are objects connected by morphisms labeled as words, forming a network of poetry. Each phrase holds an identity morphism, allowing it to be repeated within a poem. A woman on a ladder arranges these objects among the stars, crafting new constellations of language. From the same diagram, many poems can emerge, each a unique exploration of potential literature, as with Oulipo.
The Artwork in More Detail
Of Time and Cosmos is a fusion of visual art and poetry, born from a deep exploration of mathematical concepts and personal reflection. Over the course of 31 days, I engaged with a list of mathematical terms from Mathober 2022, each serving as a prompt for daily creation. Each day involved researching the meaning of the word, contemplating its implications, and then translating those insights into a unique work of art accompanied by a meditative haiku.
The artworks take place in cosmic landscapes and incorporate intricate geometric forms. Each piece interweaves abstract mathematical ideas with the natural world and human experience. Themes such as balance, motion, infinity, and interconnectedness are expressed through a variety of visual metaphors. The paired haikus complement the visuals, distilling the essence of each mathematical concept into concise, reflective verse.
This project is a journey through curiosity, self-discovery, and the beauty of both the finite and infinite.
Read the entire book featuring 31 images and 31 haikus: Of Time and Cosmos

About the Artist
Sophia Wood is an artist, poet, and educator from Salem, Oregon. Her work focuses on the connections between math, art, and their applications in science and nature. She shares her musings on her blog, fractalkitty.com.
Artist’s website: fractalkitty.com
Related Links
Learn more about category theory on Wikipedia.
Metamorphosis (2023)
Laszlo Tompa
Oak and maple wood formed using CAD software, wood lathe, and CNC router
The idea of these sculptures came into my mind during designing periodic wall tiles. I did experiments with regular triangle- and square-based meshes. I developed these to 3D tiles, by spinning them around their axis giving rotation axis objects that were halved. My starting point is always the form and I choose the material to that. At this point I changed to wood. The final complex product is assembled together from bespoke wooden revolutions, manufactured by copy lathe. The 2D templates for the individual elements were CNC cut. The separate revolutions are then fitted together by hand and fixed.
The Artwork in More Detail
The basic sphericon consists of two half elements. The novelty in my design is that I increased the number of elements to six. During the formal experiments, I noticed that a new sphericon can even be created from two different-shaped elements. Later, I increased both the number of basic elements and the number of shapes. The number of variations is enormous.
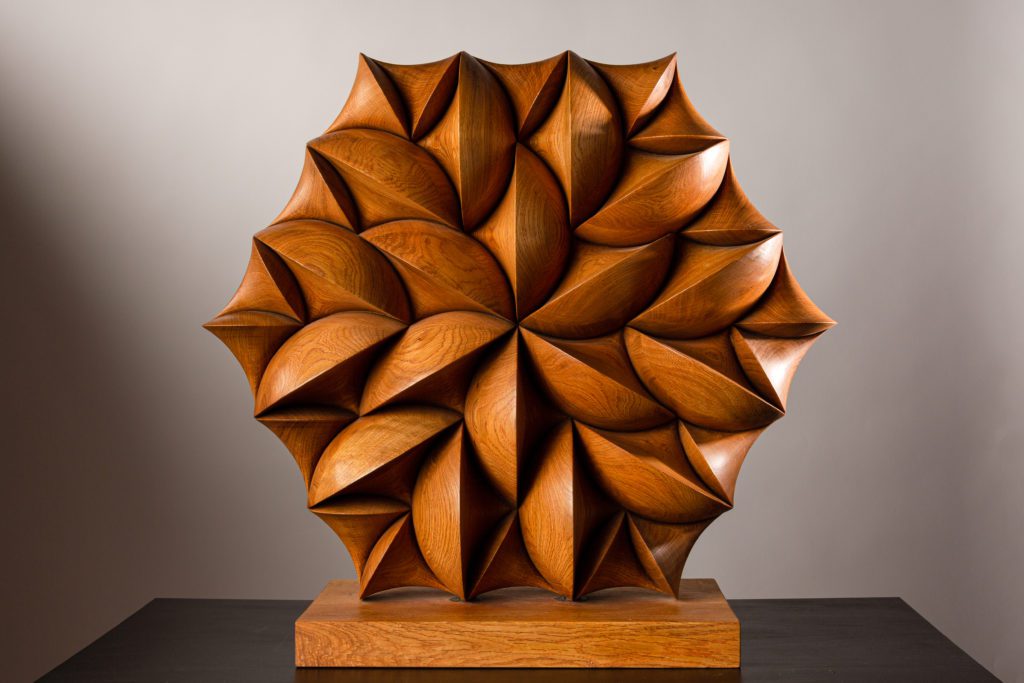
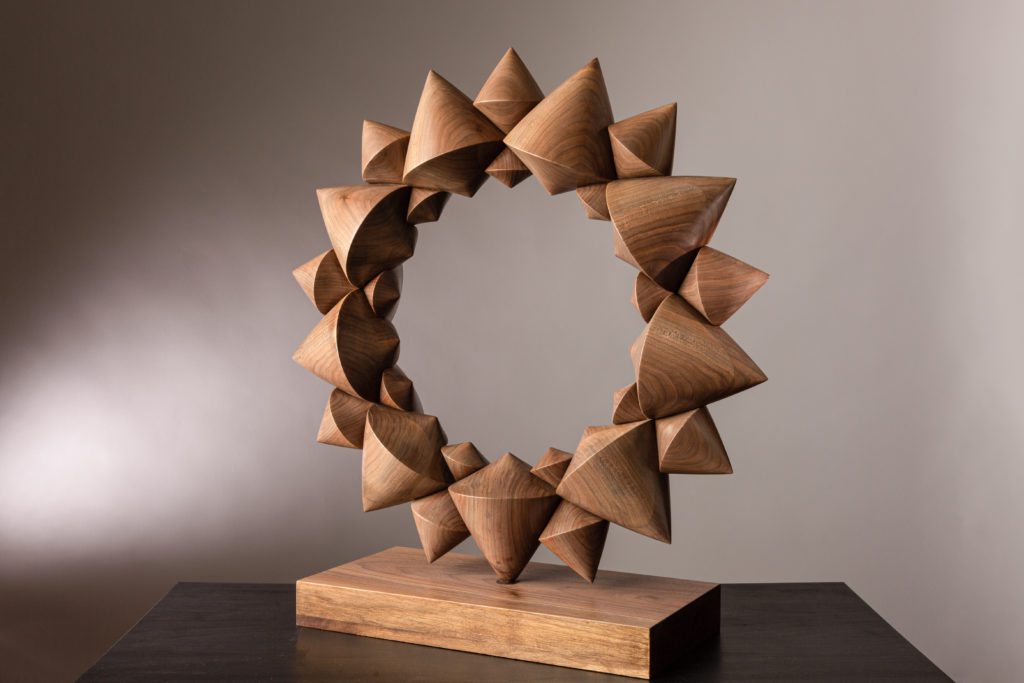

In the metamorphosis video, a centrally symmetric solid can be seen, but it is also possible to create asymmetric sphericons from multiple elements. I would like to mention the concept of tessellation here, as the sphericon always starts from a base plate, which can also be asymmetric. This base plate is covered with symmetrical plane figures in the case of multiple elements, from which I derive half solids of revolution. The outer elements will share surfaces with those on the opposite side. The sphericon shown in the video is topologically a torus; the two elements have the same volume.

About the Artist
I am a Hungarian ceramist and tile designer. My starting point is the solid object sphericon. After years of experiments I realized that it’s possible to create a body consisting of more than two elements and also having the same properties like the basic sphericon composed of two elements. I think these multi-element shapes are more suitable for creating sculptures than design objects. Both sides of the sculpture are the same just being rotated by 180 degree horizontally. Like in the case of the sphericon the surfaces are joining seamlessly.
Artist’s website: laszlotompa.com
Artist’s facebook: facebook.com/laszlo.tompa.507
Artist’s instagram: instagram.com/laszlotompadesign
Related Links
Learn more about sphericons on Wikipedia.

Sigma Star 24 Stick Knot (2024)
Anduriel Widmark
Flame worked borosilicate glass
The sculpture transforms theoretical math into tangible art by employing sigma star rod packing, a structure derived from systematically removing rods from a hexastix arrangement. This piece intricately loops and bends borosilicate glass rods into an embedded, symmetrical knot, representing one of the six invariant rod packings. The clarity of the borosilicate glass accentuates the sculpture’s internal symmetry and structure, casting intricate shadows and reflections that reveal the underlying mathematical harmony.

About the Artist
As a visual artist, I am captivated by the intricate dance of the patterns that make up our world. My journey into mathematical art began with a fascination of numbers and symmetry and has grown into exploring and creating sculptures that embody complex mathematical theories. Through my work, I aim to make abstract concepts both accessible and engaging, bridging the academic and artistic worlds. Each sculpture is a dialogue between precision and creativity, crafted to promote and celebrate the connections in mathematics and art.
Artist’s website: andurielstudios.com
Artist’s instagram: instagram.com/andurielstudios
Related Links
Learn more about Hexastix on Wikipedia.
Cohomology fractal zoom (2019)
David Bachman, Saul Schleimer, and Henry Segerman
Digital video created using software written in Javascript/GLSL
Our animation shows a zoom through a selection of “views” of the inside of finite-volume hyperbolic three-manifolds. Each three-manifold contains a surface; when a “light ray” leaves your eye it becomes darker when it crosses the surface in the positive sense and lighter when it crosses in the negative sense. The elaborate patterns come from the complicated geometry and topology of the ambient three-manifold. The names of the manifolds listed are as given in the SnapPea census.
The Artwork in More Detail
These animation was generated by cohomology_fractals, a web application written in Javascript and GLSL. It uses the local GPU to render cohomology fractals in real-time. To navigate, use the arrow and WASD keys. Also, you can change the manifold and cohomology class using the dropdown menu.
Learn more about the construction of these images, watch our explanation video or read our article from Bridges 2020.

About the Artists
David Bachman is a professor at Pitzer College in Claremont, CA. David studies geometry and topology, and enjoys creating 3D sculptures that illustrate these ideas.
Saul Schleimer is a geometric topologist, working at the University of Warwick. His other interests include combinatorial group theory and computation. He is especially interested in the interplay between these fields and additionally in the visualization of ideas from these fields.
Henry Segerman is an Associate Professor in the Department of Mathematics at Oklahoma State University. His interests include geometry and topology, 3D printing, virtual reality, and spherical video.
Related Links
Learn more about cohomology on Wikipedia.

Morse Theory, Oblique (2024)
Andrew D. Hwang
Digital image created using ePiX and the GNU Image Manipulation Program
A torus may be built by successively gluing disks along parts of their boundaries. Morse theory gives a systematic way to describe the process. Each horizontal plane determines a sublevel set of the torus, the portion below the plane. As the cutting plane moves upward, the sublevel sets are topologically unchanged unless the cutting plane is tangent to the torus. At these critical heights, the sublevel set changes by attaching a disk along part of its boundary, dictated by the number of downhill directions of the height function at point of tangency.
The Artwork in More Detail
Morse theory, established by Marston Morse in the late 1920s and now part of differential topology, describes how to build possibly-complicated objects known as “smooth manifolds” from simple standard pieces.
The prototypical example is a torus, the abstract surface of a doughnut. To make a 21st century analogy, imagine a torus leaning on edge inside a 3D printer. What do we see in a time-lapse movie of the printing process? At each time, what portion of the torus is present, and what curve(s) does the print head trace?
Initially, we see a shallow bowl, and the print head traces a single closed path. When the print reaches the bottom of the hole in the middle, something changes: the print head traces one figure-8 (note the X-shaped region toward the right side about one-third of the way up), then starts to trace two closed paths. This continues until the print reaches the top of the hole, where the two loops merge into another figure-8. After this, the print head traces a single loop, which shrinks to a point at the top.
Generally, the cross sections change precisely where a horizontal cutting plane is tangent to the torus. Morse theory details these qualitative changes for smooth manifolds of arbitrary dimension.
“Morse Theory, Oblique” depicts a torus sliced into bands and gaps. The bands’ coloration grades from warm, subterranean gold through a shadowed earth green to bright celestial aqua, suggesting rising, emergence, and completion.

About the Artist
Related Links
Learn more about Morse Theory on Wikipedia.
Glider on a 9x9x9 Rubik’s cube (2023)
David Plaxco
Stop-motion video of a 9x9x9 Rubik’s cube solved to each state, taken on an iPhone
This is a stop-motion animation depicting a “glider” element that occurs in Conway’s Game of Life. In each frame of this animation, the artist solves a 9-layer Rubik’s cube to depict the next generation in the glider’s life. The opposite edges of the 7×7 grid on one face of the cube are identified with each other so that the glider “wraps around” the face, similar to in the game PacMan, and starts over in the upper-left corner. This allows for an infinite loop of the glider across the face of the cube.

About the Artist
I am a Rubik’s cube artist. I solve large nxnxn Rubik’s cubes to aesthetic solution states, finding and exploring connections between mathematics and twisty puzzles. I have given several conference presentations, public demonstrations, and invited talks about the mathematics of the Rubik’s cube.
Artist’s website: https://www.math.uga.edu/directory/people/david-plaxco
Artist’s instagram: instagram.com/cubes_art
Related Links
Learn more about Conway’s Game of Life.
Learn more about the mathematics of a Rubix’s Cube.

Dancer (2021)
Ching-Tai Meng
3D Printed UV Resin designed in Rhino 7
Torus knots are knots that lie on the surface of a torus and are defined by two relatively prime parameters p and q. An envelope of a curve is a collection of curves tangent to the original curve.
I explored envelopes of lines of (p,q)-torus knots by varying the length, number, and the angles of the lines. The finished work spins like an impromptu dancer and the virtual shadows are like her flowing eyes.
As I sprayed the only unturned envelope with passionate colors, I felt it, originally divine and perfect, suddenly coming alive.
The Artwork in More Detail
I heard about the torus knot for the first time at the end of August 2019, and fell in love with the rules behind it. The key is how many knots there are and how the knots are tied, not the parametric equations that define it. I started from the geometric structure and explored various combinations using Rhino software. I also defined a symbol T(m, n) whose relationship with p and q is:
T(m,n) ~ d x (p,q), where m = d x q, n = d x p, and d=gcd(m,n). When m and n are relatively prime, T(m, n)=(q,p).
When m and n are relatively prime, the torus knot is a cycle. When m and n are not relatively prime, such as in T(12, 8), there are four copies of (2,3).
The pictures is the envelope of T(5,3). The work in the video is the envelope of T(4,3) rotated by an angle relative to the tangent plane. They are all full of dynamic beauty.
How do I think about the envelope? Imagine the trajectory formed by all the droplets (real objects that look like “points”) on the curve when they are thrown along the curve at the same time. Oh! How beautiful the picture is.
After all, mathematics deals with facts, and art focuses on opinions. When the two meet, it is full of fun.
Experience a video about these objects produced by the artist.

About the Artist
My name is Ching-Tai Meng. I am from Taiwan, Republic of China. Retiring from my teaching career of mathematics in August, 2021, I continue to explore the world of mathematics by creating art work out of math. You are sure to find math, regardless of simple or complex, in my work.
Artist’s Online Gallery.
Related Links
Learn more about torus knots, a tangent lines to a curve, and an envelope of a curve on Wikipedia.

Brain Maze 3 (2023)
Jeffrey Ventrella
Digital image generated from JavaScript, color-enhanced with Gimp image-manipulation program
This is a color-enhanced plane-filling fractal curve from a series of “Brainfiller curves”; artworks that reference the fractal nature of consciousness. The algorithm is based on complex number integers in the triangular Eisenstein lattice. As described in fractalcurves.com, the algorithm uses complex operations in a recursive function to generate plane-filling curves at a level of detail that allows the eye-brain to appreciate self-similar patterns. The original mathematically-generated line drawing is post-processed by hand with shading effects and colored regions to visually enhance features.

About the Artist
Related Links
Learn more about space-filling curves on Wikipedia.

Modular Flow (2022)
Clayton Shonkwiler
Digital animation created in Mathematica
This animation visualizes the modular flow. While the individual points all eventually go off to infinity, if we think of this as a flow on the lattice as a whole, it is periodic: the lattice eventually comes back to itself. This connects to a surprising number of topics in mathematics, including complex analysis, hyperbolic geometry, number theory, and algebraic geometry.
The Artwork in More Detail
One way to think about what’s going on is that the group G={diag(eᵗ, e⁻ᵗ)} of 2 × 2 diagonal matrices of determinant 1 is acting on the plane. This action is pretty much the simplest possible action which motivates the notion of a Geometric Invariant Theory (GIT) quotient: if this group acts on points of the form (x,y), then the product xy is conserved, so each nonzero number λ corresponds to an orbit which is just the hyperbola xy=λ. However, there are three different orbits for which xy=0, namely the two axes (with the origin removed) and the origin itself. Unfortunately, the closures of these three orbits intersect, so the orbit space is non−Hausdorff unless we do something slightly more sophisticated. In GIT, the upshot is to identify the three orbits and then the orbit space is just a copy of the line.
However, there’s rather more going on in the visualization. If we think of a lattice Λ in the plane ℝ², then we can think of G as acting on Λ. Of course, this will generally change the lattice, but if we choose the lattice very carefully, we can get a periodic action: after some finite time t₀, the lattice comes back to itself (even though the individual points have of course moved, and always end up shooting off to infinity). This is the modular flow.
This work was partially supported by the National Science Foundation (DMS–2107700).

About the Artist
Clayton Shonkwiler is a mathematician and artist working at Colorado State University. He is committed to using geometry to understand the world.
Artist’s website: shonkwiler.org
Related Links
Modular flow introduction by Bruce Bartlett: https://golem.ph.utexas.edu/category/2014/04/the_modular_flow_on_the_space.html
Animation source code (with descriptions): https://github.com/shonkwiler/geometry-in-motion/blob/main/source/flow.nb
Source code in a viewable format: https://community.wolfram.com/groups/-/m/t/3061781


Laser Cyanotype Harmonograms (2023)
Ralf Jacobs
Cyanotype photograph of movements of a laser guided by mirrors controlled by software
An old-fashioned harmonograph is a machine with rods and weights that mechanically moves a pencil across a piece of paper. Driven by the swinging motions of two or three pendula, it produces an endless variety of intricate elliptic line drawings including Lissajous curves. Jacobs uses software that emulates these motions to create digital versions. It allows him to tinker with variables like frequency and phase, until a pattern emerges that shows the beauty of scientific imagination, liberating it from its mathematical equations. The final pieces are realized with laser projections onto 19th-century cyanotypes.
The Artwork in More Detail
Here is an illustration about how the harmonograph draws lissajous curves.

The laser I use uses a device galled a XY galvo scanner with two rotating actuators that steer the angle of the laser beam in two directions. When I steer a sine wave to the rotating mirrors, the signal very much resembles natural oscilations from a pendulum.


About the Artist
Perhaps it is best to describe Ralf Jacobs as a photographer. He ‘writes with light’ in a wonderful spectrum of old and new techniques, from 19th-century cyanotypes to software-guided laser projections. Combining different photographic procedures and images, he creates new realities that incorporate time as a tangible presence.
The light phenomena captured by Ralf Jacobs in their appealing complexity and poetic beauty suggest an enviable innocent sense of wonder about the world. Jacobs has retained the ability to be mesmerized by rays of light and their intricate behavior, even when his profound expertise in optics, lenses and perception might go a long way to elucidate the physical principles behind them. These principles can’t, of course, explain why the images constantly generate new questions and ideas, nor why Jacobs’ photographs can elicit such emotion and meaning.
Artist’s website: ralfjacobs.net
Related Links
Learn more about Lissajous curves, the harmonograph, and cyanotypes on Wikipedia.
Here is a PDF that describes the mathematics of a harmonograph.

About the Curator
Christopher R. H. Hanusa is a Professor of Mathematics at Queens College. His mathematical research is in algebraic and enumerative combinatorics, most recently studying the combinatorics of flow polytopes. He is also a mathematical artist whose works are often generative in nature and draw on his varied mathematical interests. A key emphasis of his art is on the play between randomness and deliberation. His mathematical jewelry is in the gift shops at the National Museum of Mathematics and the Queens Museum and has been featured multiple times in the Math+Fashion show at the Bridges Conference.
Visit Christopher Hanusa’s portfolio on the web at christopherhanusa.com and follow him on social media at @mathzorro: (bluesky) (instagram).
Institutions interested in partnering with Queens College to host this exhibition on their local displays should contact Prof. Christopher Hanusa (he/him) at chanusa (at) qc.cuny.edu.
Can’t wait to experience more Mathematical Art?
View the Exhibitions from the Bridges Organization, featuring connections between mathematics and art, music, architecture, and culture.
Attend the monthly chats and presentations by the Illustrating Mathematics community.
Read the articles in the Journal of Mathematics and the Arts.